“You’ve got to know what it costs to know what it’s worth.” That wisdom rings especially true when evaluating Configure, Price, Quote (CPQ) software investments that can make or break your revenue operations.
The CPQ software market has exploded. MGI Research projects the five-year Total Addressable Market for CPQ software globally will exceed $45 billion, while global spend on cloud CPQ tools by publicly traded companies is estimated to reach nearly $5.8 billion in 2026. But here’s the catch – most companies focus only on sticker price while missing the real cost drivers that determine true CPQ total cost of ownership.
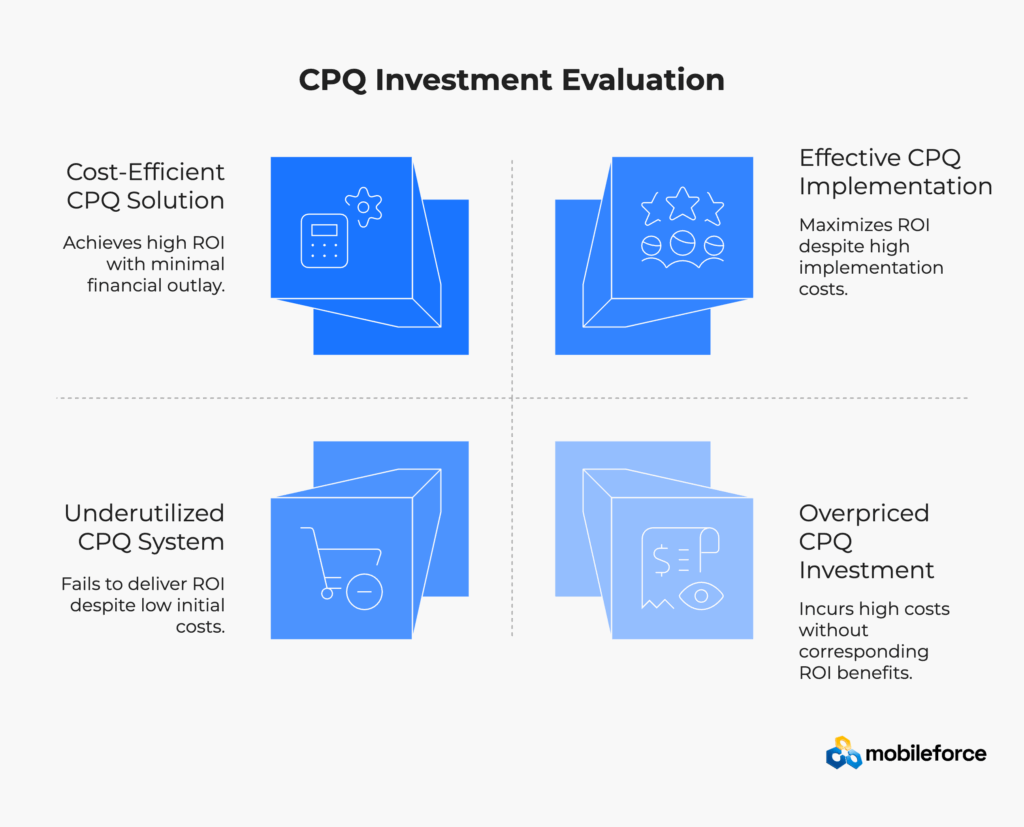
CPQ Total Cost of Ownership (TCO) encompasses every dollar you’ll spend over your system’s lifetime. Think license fees, implementation services, ongoing maintenance, integrations, training, and hidden operational costs that sneak up later.
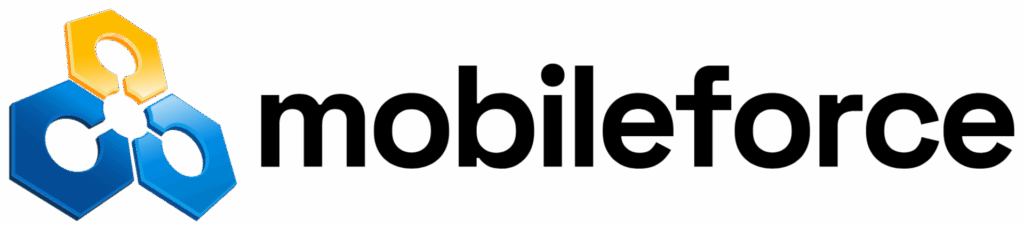
The stakes are high. Get total cost of ownership analysis wrong, and your “budget-friendly” CPQ solution becomes a money pit. Get it right, and you’ll join organizations achieving over six dollars gained for every dollar invested in CPQ deployments.
The CPQ market is projected to grow at a compound annual growth rate (CAGR) of 16-20% over the next several years, fundamentally changing cost structures. Traditional on-premise budgeting models no longer apply when you’re dealing with subscription services, API usage fees, and cloud infrastructure scaling.
Most finance teams discover licensing represents only 20-30% of total ownership costs over five years. The remaining 70-80%? That’s where organizations either achieve breakthrough efficiency or watch their CPQ software costs spiral out of control.
The total cost of ownership for CPQ systems varies dramatically based on implementation approach, integration complexity, and ongoing management requirements. Understanding these variables helps organizations make informed decisions about their CPQ investment strategy.
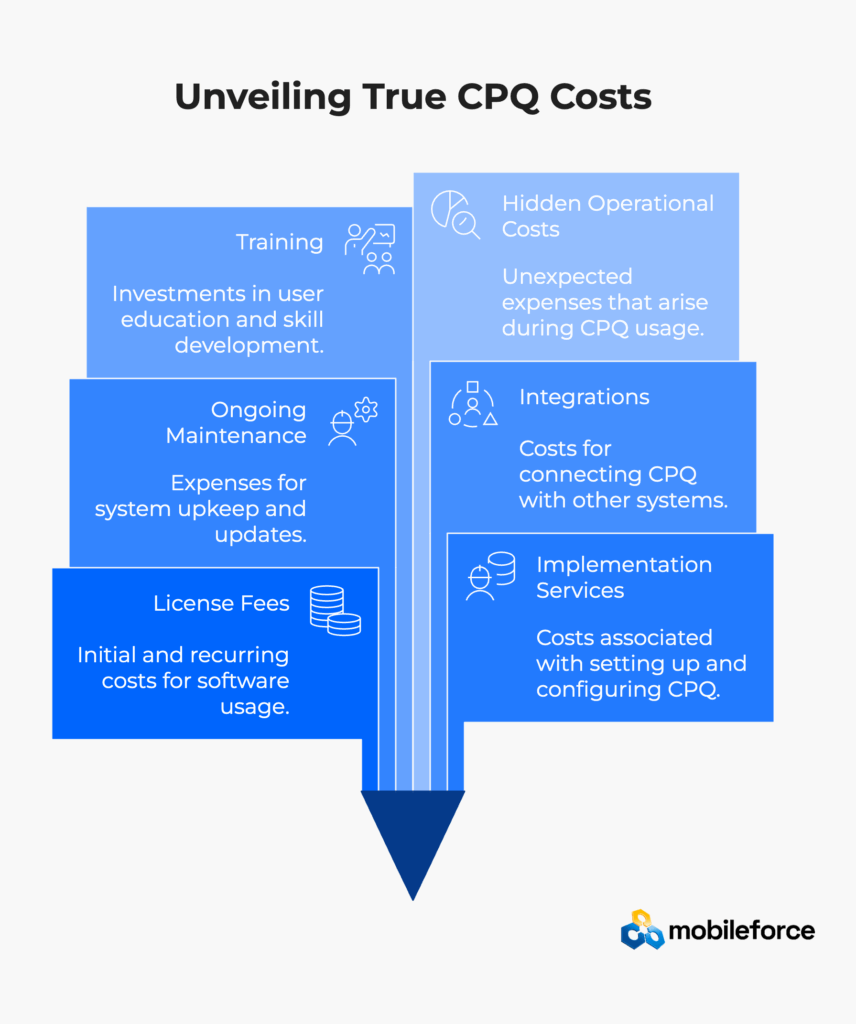
Seat-based CPQ software costs seem straightforward – pay per user, scale as needed. Industry pricing typically ranges from \$75-200 monthly per user for mid-market CPQ solutions. Enterprise platforms? Expect $300-500 per seat for comprehensive total cost of ownership.
But growth-stage companies get hammered. Imagine starting with 25 sales reps at $150/month each. Eighteen months later, you’ve doubled your team. Your CPQ implementation expenses just jumped from $45,000 to $90,000 annually – a 100% increase that might outpace revenue growth.
Smart buyers negotiate volume discounts and hybrid structures when evaluating CPQ software costs. Distribution companies often secure arrangements where per-seat costs drop from $150 for the first 50 users to $100 for users 51-100, based on common industry pricing negotiations for CPQ total cost of ownership optimization.
Usage-based pricing charges for quote volume, transaction count, or revenue processed. This creates natural alignment between CPQ costs and business activity, but introduces unpredictability in your total cost of ownership calculations.
Manufacturing companies experience quote volume swings of 300-400% during peak seasons according to industry surveys. A company paying $5 per quote might see monthly CPQ software costs swing from $10,000 in slow periods to $40,000 during busy seasons.
Hidden Cost Alert: Usage overages during product launches or seasonal spikes create budget surprises that impact total cost of ownership. Organizations using AI-driven CPQ tools saw a 20% increase in customer satisfaction, but these advanced features often trigger higher usage tiers that increase overall CPQ implementation expenses.
Fixed subscription pricing provides cost predictability through defined feature sets and user limits. Understanding these tier structures is crucial for accurate total cost of ownership planning:
The trap emerges when you need 30 users but only require basic functionality. You’re forced into higher tiers for capacity, paying for advanced CPQ features you won’t use – a common mistake in total cost of ownership planning.
Build Costs: One-time investments for CPQ system setup including software configuration, workflow design, CRM integration, ERP connections, data migration, and initial user training. Modern no-code CPQ platforms can reduce build effort by 40-60% compared to traditional approaches, significantly impacting total cost of ownership.
Ongoing CPQ Investment: Continuous expenses for product catalog updates, pricing rule modifications, promotion management, workflow refinements, and new user training. These CPQ software costs scale with business complexity and change frequency, representing the largest portion of total cost of ownership.
Migration Costs: Often overlooked expenses for moving legacy quote data, maintaining active proposals during transitions, and ensuring business continuity. Poor migration planning can cost 2-3x original estimates, severely impacting your CPQ total cost of ownership projections.
Integration Complexity: The TCO Multiplier
CPQ systems connect to CRM platforms for opportunity management, ERP systems for inventory data, billing platforms for revenue processing, and specialized tools for contracts or partner portals.
CPQ implementation expenses scale exponentially:
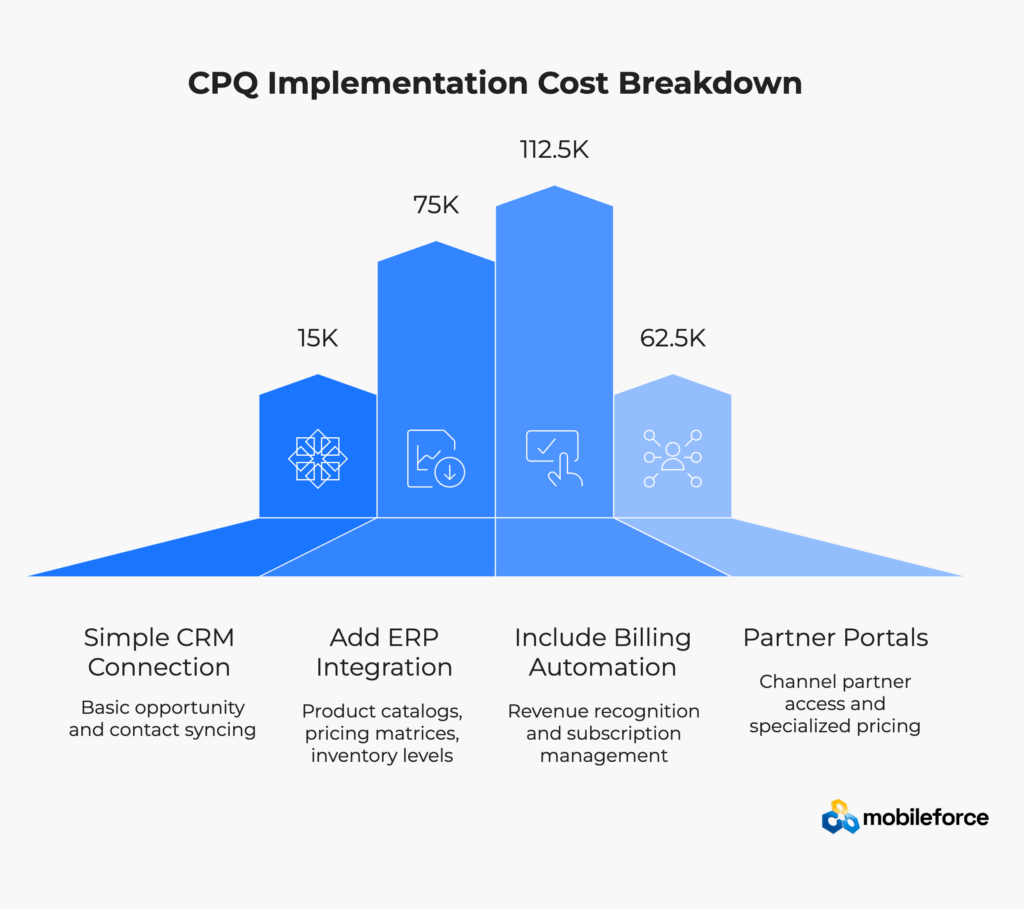
A telecommunications company might budget \$75,000 for CPQ integration based on CRM connection estimates. Final total cost of ownership could reach $280,000 as ERP complexity, billing requirements, and partner portal needs emerge.
User Adoption: The Make-or-Break Factor for CPQ ROI
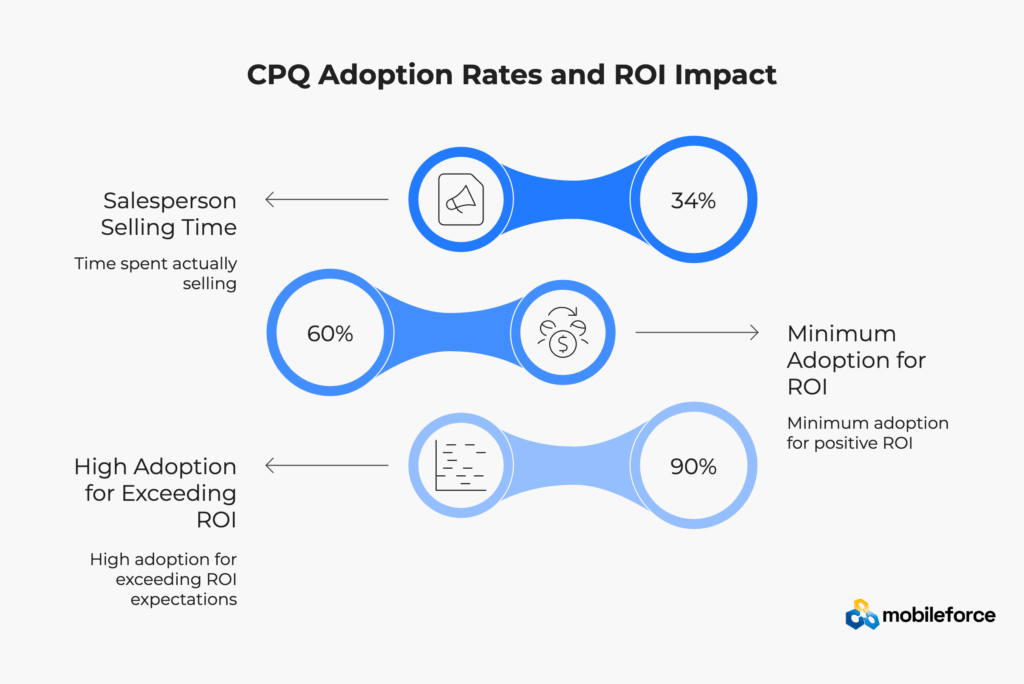
Poor CPQ adoption destroys ROI faster than any technical issue. Research shows that only 34% of a salesperson’s time is actually spent selling, with administrative tasks consuming the remainder. Effective CPQ software can eliminate much of this administrative burden – but only if users actually adopt the system.
Organizations with CPQ adoption rates below 60% rarely achieve positive ROI on their total cost of ownership investment. Those reaching 90%+ adoption see returns exceeding expectations by 30-50%.
Successful implementations invest 20-30% of total CPQ implementation expenses in change management:
Most organizations see positive CPQ ROI within 12-18 months of implementation. Research from Nucleus Research found that businesses averaged $6.22 in returns for every dollar invested in CPQ deployments over a three-year period – making the total cost of ownership analysis highly favorable.
Key CPQ ROI drivers that justify the total cost of ownership include:
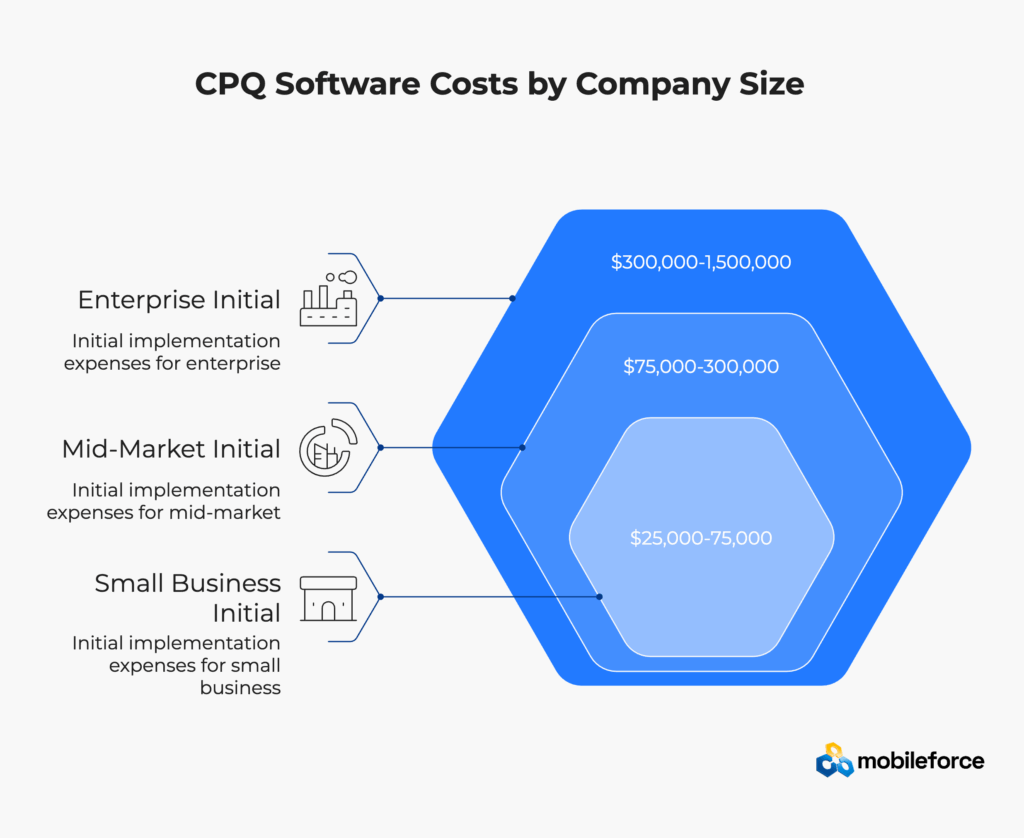
Small Business CPQ Total Cost of Ownership (10-50 employees)
Mid-Market CPQ Investment (50-500 employees)
Enterprise CPQ Implementation Expenses (500+ employees)
Understanding these benchmarks helps organizations set realistic expectations for their CPQ total cost of ownership planning and budget allocation.
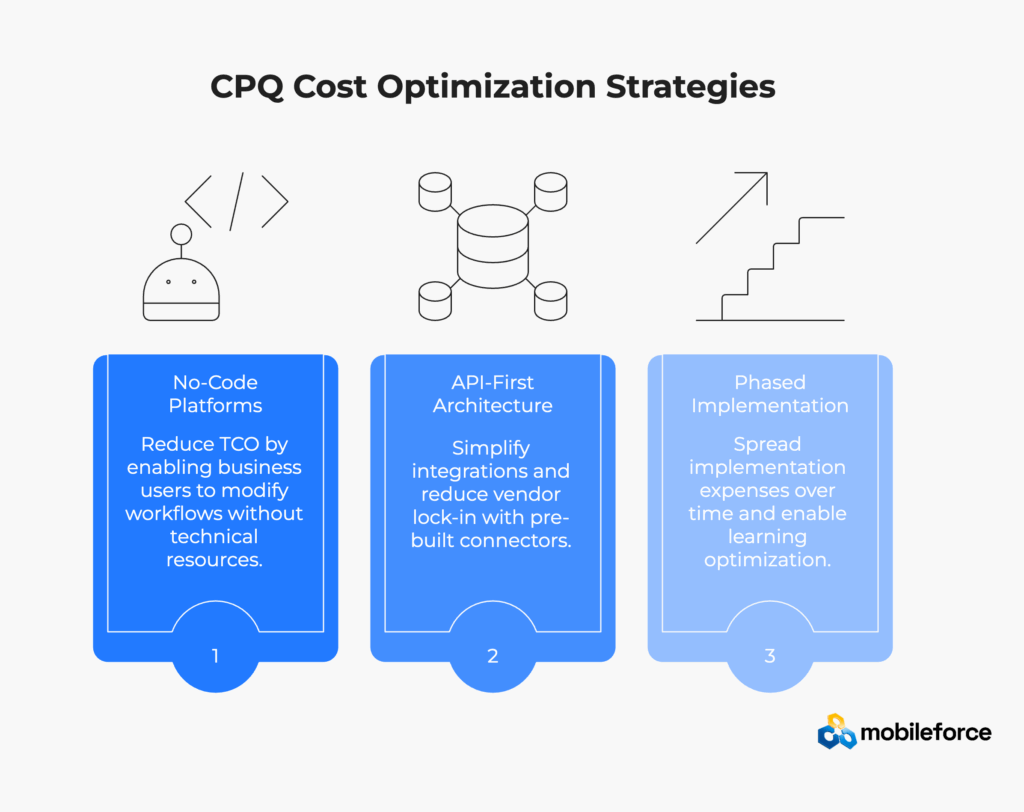
No-code CPQ solutions enable business users to modify workflows, pricing rules, and product configurations without technical resources. This capability can reduce total cost of ownership by 30-40% over five years for organizations with frequent process changes.
Traditional customization approach: Modifying an approval workflow requires developer time ($150/hour), testing cycles, and deployment coordination. A simple change takes 40-60 hours, costing $6,000-9,000 in CPQ implementation expenses.
No-code approach: Business users drag and drop workflow elements, test in sandbox environments, and deploy instantly. The same modification takes 2-4 hours of business user time.
Organizations making frequent CPQ process changes can reduce ongoing total cost of ownership by $50,000-100,000 annually through no-code capabilities.
API-first CPQ platforms future-proof investments by simplifying integrations and reducing vendor lock-in. Pre-built connectors can reduce integration costs by 40-70% while improving reliability – a significant factor in total cost of ownership optimization.
Traditional integration creates point-to-point connections that break during system upgrades, increasing CPQ software costs over time. API-first integration uses standardized interfaces enabling plug-and-play connectivity that reduces long-term total cost of ownership.
Phased rollouts spread CPQ implementation expenses over time and enable learning optimization:
Phase 1: Core quoting and basic approval workflows (Months 1-3)
Phase 2: Advanced pricing rules and product configuration (Months 4-6)
Phase 3: Partner portals and advanced analytics (Months 7-9)
This approach reduces initial CPQ investment requirements, enables faster ROI realization, and allows course corrections based on user feedback – optimizing total cost of ownership outcomes.
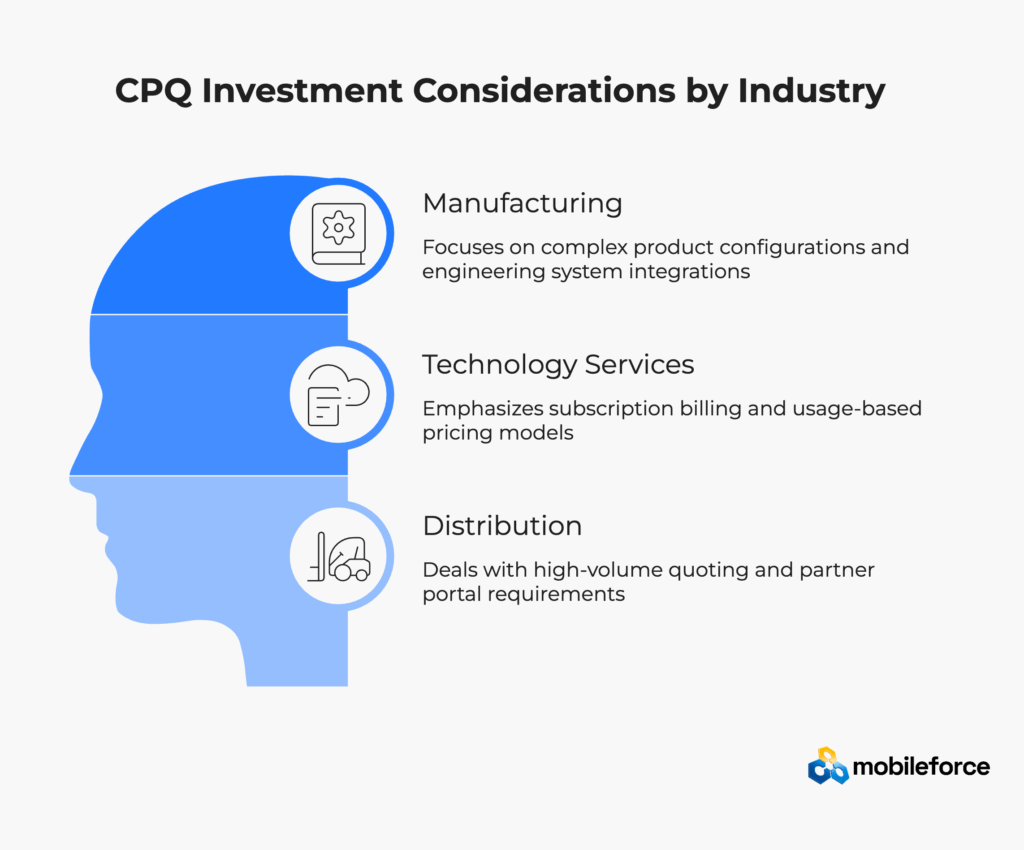
Manufacturing companies face complex product configurations and engineering system integrations. CPQ implementation expenses run higher due to technical complexity, but value delivery is substantial through improved quote accuracy and fulfillment efficiency.
Key considerations affecting total cost of ownership:
Manufacturing organizations typically see 15-20% higher initial CPQ software costs but achieve 40-50% faster quote generation times, justifying the total cost of ownership investment.
Technology service companies require subscription billing integration and usage-based pricing models. These specialized requirements affect platform selection and ongoing operational costs in total cost of ownership calculations.
Critical capabilities impacting CPQ total cost of ownership:
Distribution companies handle high-volume quoting and extensive partner portal requirements, influencing platform capacity planning and licensing model selection for optimal total cost of ownership.
Essential features affecting CPQ software costs:
Distribution organizations often negotiate usage-based pricing to align CPQ costs with transaction volume, optimizing total cost of ownership for seasonal fluctuations.
Factor your organization’s change patterns into total cost of ownership calculations. High-change organizations benefit more from flexible, no-code platforms despite potentially higher upfront CPQ software costs.
Change Pattern Analysis for Total Cost of Ownership:
Technology companies launching features monthly face different total cost of ownership structures than stable manufacturing operations. Traditional CPQ requires developer time for each product update – roughly 20 hours at $150/hour, or $3,000 per change. With monthly updates, this creates $36,000 in annual maintenance costs that significantly impact total cost of ownership.
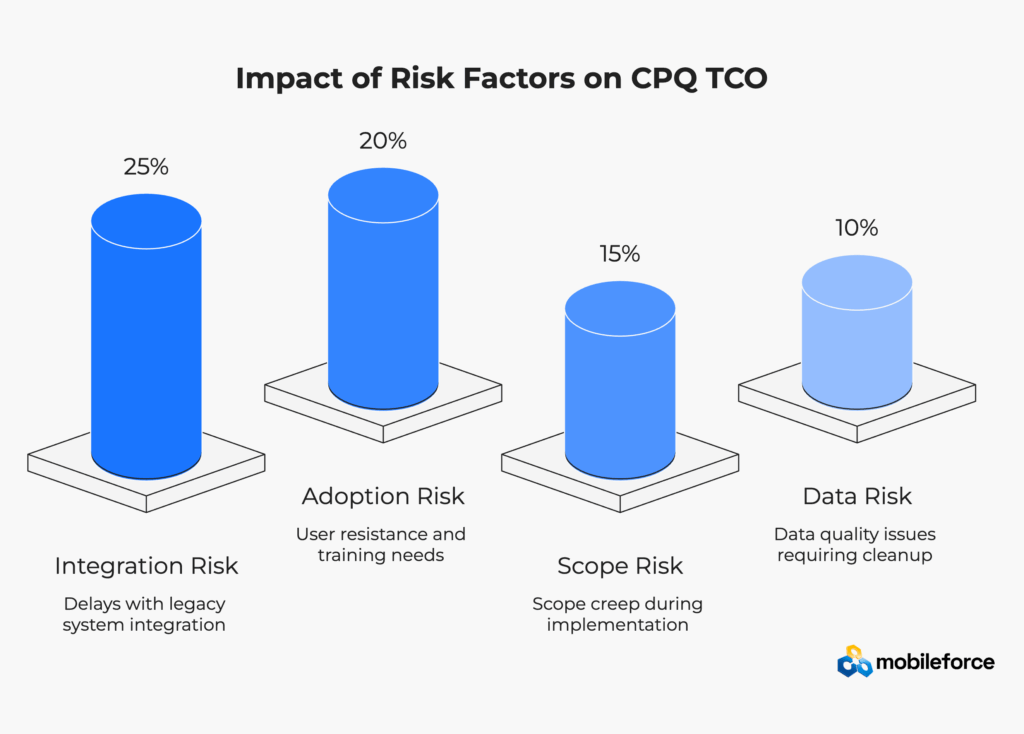
Add risk buffers of 15-25% for complex implementations when calculating total cost of ownership:
Common Risk Factors Affecting CPQ Implementation Expenses:
Risk-Adjusted Total Cost of Ownership Formula: Base TCO + (Integration Risk × 25%) + (Adoption Risk × 20%) + (Scope Risk × 15%) + (Data Risk × 10%)
For a $500,000 base total cost of ownership, risk adjustments might add $75,000-125,000 to create realistic CPQ software costs projections.
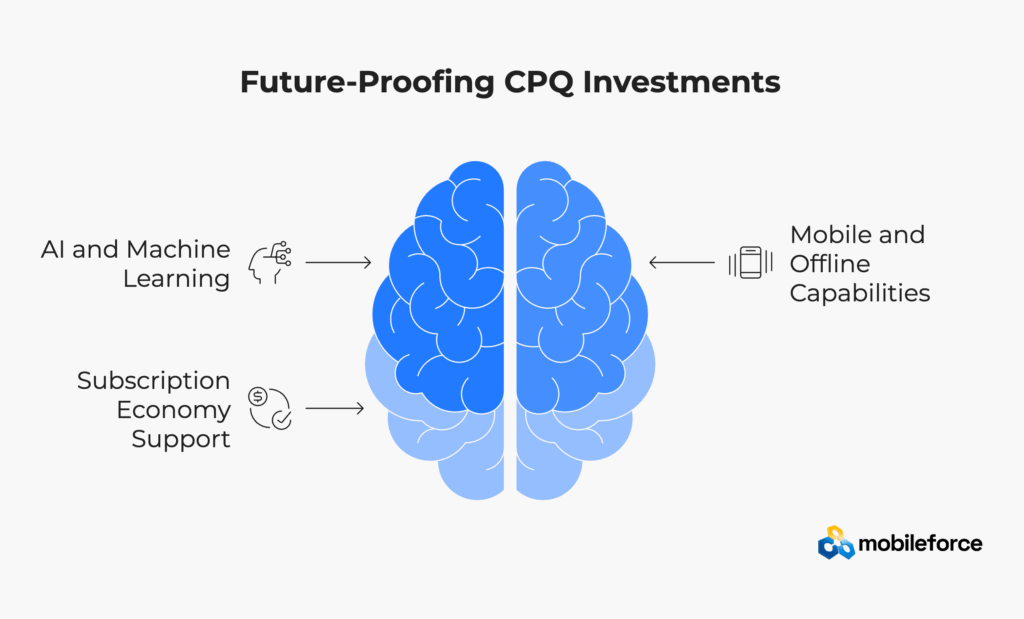
Advanced CPQ platforms increasingly include AI-powered features for pricing optimization, quote accuracy improvement, and approval workflow automation. While premium-priced, these features reduce operational costs and improve sales effectiveness – often improving long-term total cost of ownership despite higher initial CPQ implementation expenses.
Field sales teams need CPQ access regardless of connectivity. Platforms supporting offline functionality enable productivity in challenging environments but may require additional infrastructure investments that affect total cost of ownership planning.
As businesses adopt recurring revenue models, CPQ platforms must handle subscription pricing, renewal automation, and usage-based billing. Ensure your platform evolves with business model changes to protect your total cost of ownership investment.
You’ve calculated your CPQ total cost of ownership down to the penny, survived the implementation, and watched users slowly embrace the new system. Now what? The real question isn’t whether you stayed on budget – it’s whether your investment is actually working.
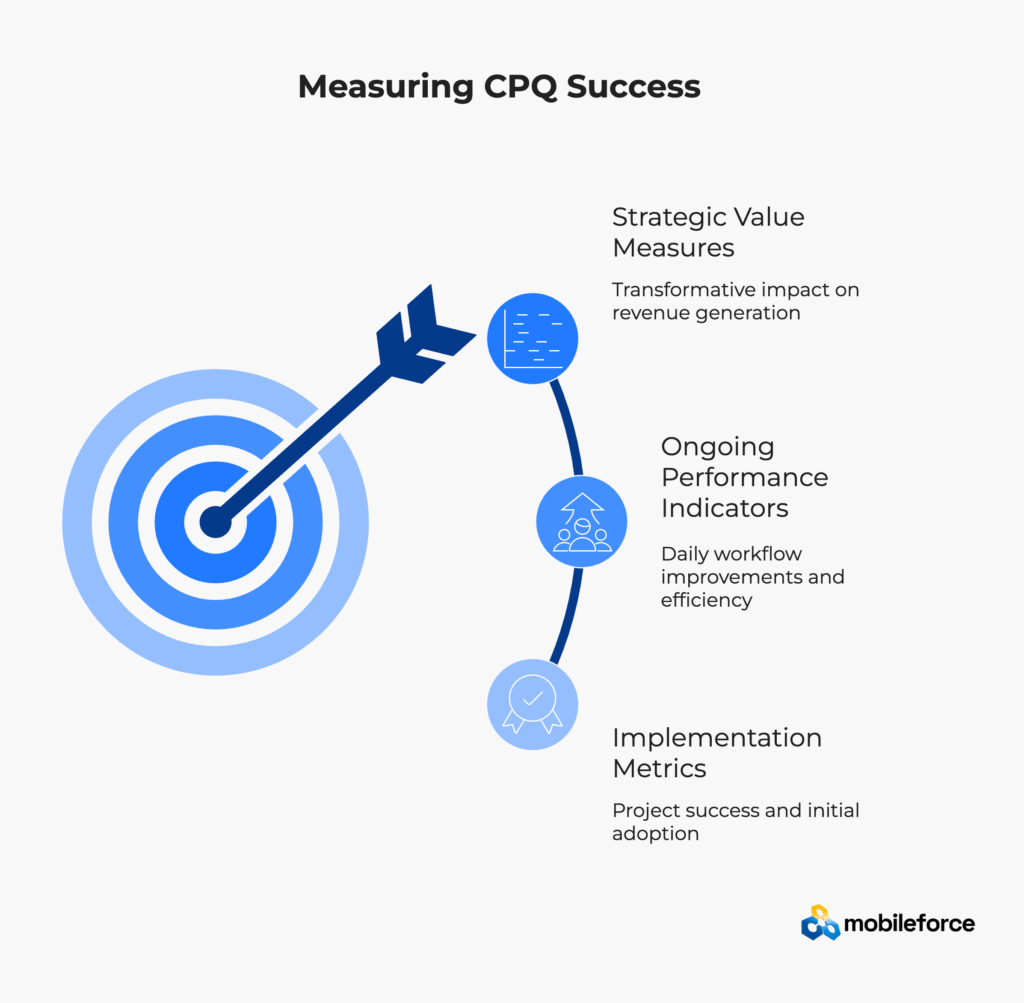
Most organizations make a critical mistake here. They measure CPQ success the same way they’d evaluate any software purchase – uptime, user adoption, maybe a few productivity metrics. But CPQ isn’t just software. It’s the engine that drives your entire revenue operation.
Smart companies track CPQ performance across three distinct dimensions. Implementation metrics tell you if the project succeeded. Operational indicators reveal whether the system is improving daily workflows. Strategic measures show if your CPQ investment is genuinely transforming how you generate revenue.
The challenge? Traditional business metrics often miss CPQ’s most significant impacts. Revenue cycle acceleration might not show up in monthly sales reports for quarters. Pricing accuracy improvements could be invisible until you analyze margin trends over time. Deal size increases from better product configuration might get attributed to market conditions rather than system capabilities.
Here’s how leading organizations really measure CPQ success – and why total cost of ownership is just the beginning of the conversation.
These metrics help validate whether your CPQ total cost of ownership investment delivers expected business value beyond simple cost considerations.
CPQ total cost of ownership analysis extends far beyond initial software costs. The most successful implementations balance upfront investments with long-term operational efficiency, user adoption success, and strategic business alignment.
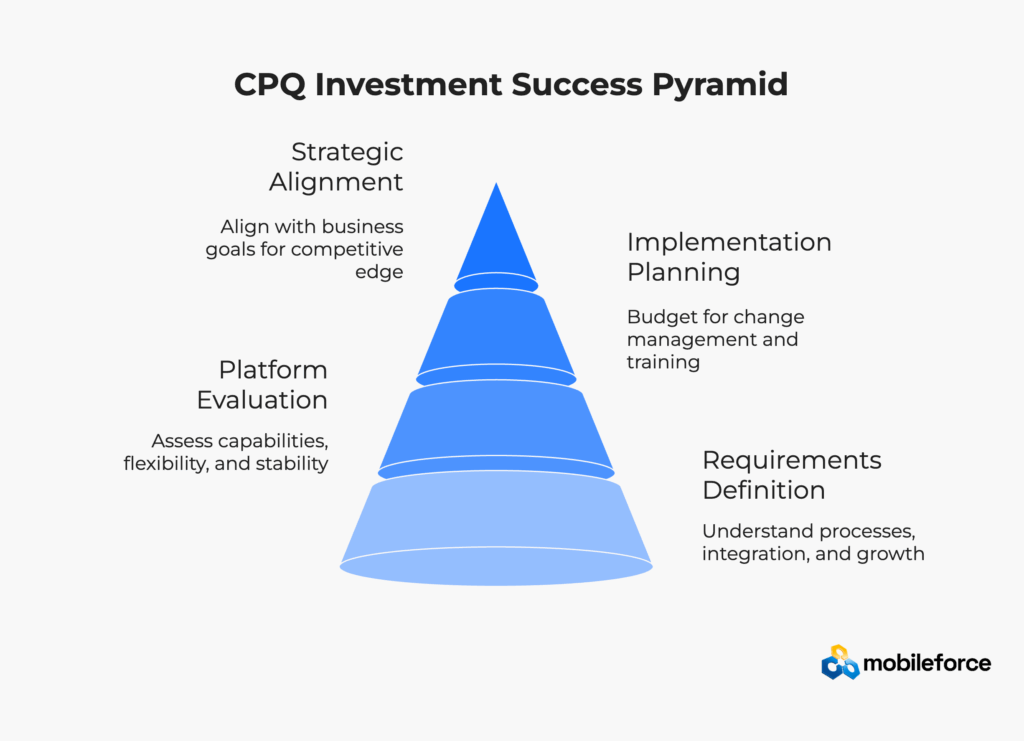
Start with comprehensive requirements definition. Understand current quoting processes, integration needs, user roles, and growth projections. This foundation enables accurate total cost of ownership modeling and meaningful vendor comparisons.
Evaluate CPQ platforms holistically. Consider current capabilities and future flexibility, vendor stability, and ecosystem strength. The lowest initial CPQ software costs rarely equal the lowest total cost of ownership.
Plan for implementation success from day one. Budget adequately for change management, comprehensive training, and ongoing optimization. The best CPQ technology implementations succeed through people and process excellence, not just software features.
The CPQ market offers unprecedented opportunities for sales operations optimization. Organizations approaching platform selection with comprehensive total cost of ownership analysis position themselves for sustainable competitive advantage through improved revenue operations efficiency.
Ready to dive deeper into CPQ cost analysis for your specific situation? Schedule a personalized demo to explore total cost of ownership scenarios based on your unique requirements.
Most organizations see positive CPQ ROI within 12-18 months of implementation. Research from Nucleus Research found that businesses averaged $6.22 in returns for every dollar invested in CPQ deployments over three years. ROI timing depends on implementation complexity, user adoption rates, and efficiency gains achieved – all factors that influence total cost of ownership calculations.
Hidden costs typically account for 60-70% of total CPQ ownership expenses over five years. These include ongoing maintenance, customization updates, integration modifications, training new users, and system administration resources. Organizations budgeting only for licensing and initial implementation often experience 2-3x cost overruns in their total cost of ownership projections.
Integration complexity is the biggest total cost of ownership driver, often accounting for 25-35% of total costs. User adoption challenges can increase ongoing support costs by 200-300%. Platform flexibility affects long-term total cost of ownership significantly – rigid systems require expensive customizations for business changes, while no-code platforms enable business user modifications without technical resources.
Cloud solutions reportedly accounted for over 60% of the market share in 2024 due to lower maintenance requirements and improved scalability. Cloud deployments typically reduce total cost of ownership by 20-30% compared to on-premise alternatives through eliminated infrastructure costs, automatic updates, and reduced IT resource requirements.
Seat-based pricing charges per active user, providing cost predictability but potentially creating growth penalties as teams expand. Usage-based models charge based on quote volume or transaction count, aligning costs with business activity but creating unpredictability during growth or seasonal fluctuations. Hybrid models combine fixed subscriptions with usage components for balanced total cost of ownership risk profiles.
Implementation timelines vary significantly based on complexity. Simple deployments with minimal customization complete in 6-12 weeks. Enterprise implementations with extensive integrations and customizations typically require 6-12 months. No-code platforms can reduce implementation time by 40-60% compared to traditional customization approaches, positively impacting total cost of ownership through faster time-to-value.
User adoption is critical for CPQ ROI realization and optimal total cost of ownership outcomes. Poor adoption negates system benefits as sales teams revert to familiar tools. Research shows that only 34% of a salesperson’s time is actually spent selling, with administrative tasks consuming the remainder. Successful implementations invest 20-30% of total budget in change management, achieving high adoption rates that directly correlate with faster ROI achievement and lower ongoing total cost of ownership.
Integration costs scale exponentially with complexity and represent a major component of total cost of ownership. Simple CRM connections might cost $10-20K, while comprehensive ERP, billing, and partner portal integrations can reach $200K+. Platforms with pre-built connectors and API-first architecture significantly reduce these costs and ongoing maintenance requirements, improving overall total cost of ownership.
Plan for 18-22% of license costs annually for software maintenance fees, plus internal resources for system administration, catalog management, and user support. Many organizations underestimate total support costs by 50-100% in their initial total cost of ownership calculations. Include dedicated system administration resources and periodic process optimization in budget planning for accurate total cost of ownership projections.
No-code platforms can reduce total cost of ownership by 30-40% over five years for organizations with frequent process changes. They enable business users to modify workflows, pricing rules, and configurations without technical resources, significantly reducing ongoing customization costs that impact total cost of ownership. Evaluate whether no-code capabilities meet your specific customization requirements before making platform decisions that will affect long-term total cost of ownership.
